
Analyzing 2013-2025 large grazing species populations
-
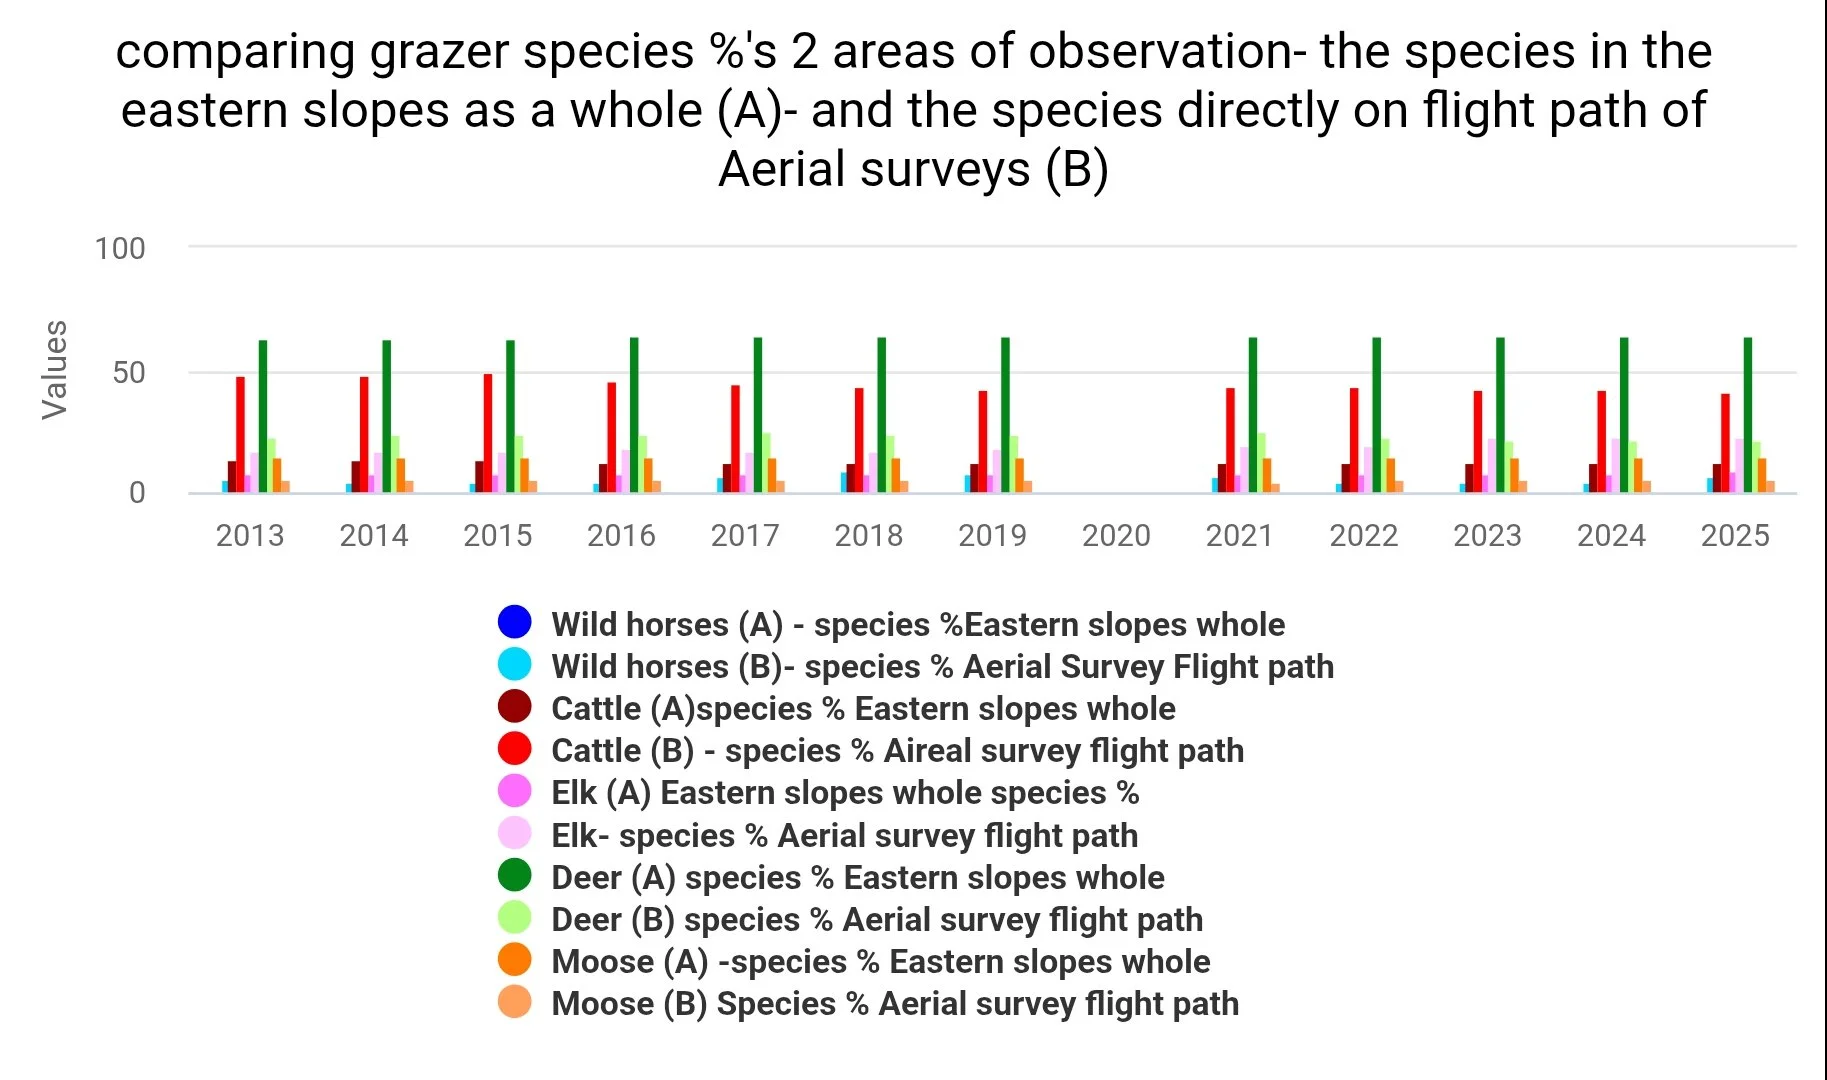
Large grazing species 2013-2025 (A= the whole eastern slopes population, B=species only directly on the gov. Aerial survey flight path for wild horses)- comparison
we already looked at the 2025 data, for wild horses and large grazing species, we will continue this study a bit further and we will see what this looks like over the years (2013-2025) with 2025 now over, we are wrapping up our 2925 studies to release.
So we broke down the 5 main large grazing species each into two categories. The eastern slopes as a whole, and we made a second category for only the populations which directly links to the government survey flight path. Wild horses have aerial count down almost annually while the government used to only check prefered wild horse areas, they now flight in grid formation, as you will see later because they pick and choose where they look they get very inaccurate data. This first photo, chart, is both categories (Labeled A and B) to see both areas as a whole. Why do we separate this data in this way? Because essentially, it helps us to “ see what the government sees” when they do this annual survey. The category B is the least accurate data, as wild animals tend to flee for cover when scared, helicopters evoke a flight instincts in wildlife, deer, elk and moose running for shelter. So often times, these species are well hidden before the helicopter nears them. The second reason it is inaccurate or inconsistent is due to where they survey and how they survey. The flight grids never remain the same, a constantly changing variable. While some years they check specific meadows, other years they check 2 or 3 zones, every 2 or 3 years they check all zones (partially) but never are the resources invested to survey every area as a whole, every year in the same grid formation, same direction, same days of the year (to account for migratory routes) as well as flying the same elevation,speed, time and distance. This would be the only way to keep consistent and reliable data, if they cannot afford this method, it should be switched to every 2-5 years more time to save for the survey costs and more time in between each survey. Either way to have accurate data, keeping consistency is key, and consistency is greatly lacking in regards to aerial surveys (all aereal surveys).
While wild horses are surveyed every year, deer, elk and moose are only surveyed every 2-5 years. Meaning on paper, it looks like wild horse are growing at smaller but faster rates than other species every year, when in reality, the government is not actively managing or culling other species, meaning there time, and resources are spent on “managing” the wild horse herds. Every other species is growing well every year if they are only surveyed every 2-5 years a 20k increase in deer is not a new one year change but a few years of growth that went undocumented. So we have to keep that in mind when looking at over all herd populations , wild horses are the only ones with new head counts every year.
So back to the chart we see above ( feel free to scroll back up to the chart anytime you need a refresher on what we are talking about)
Wild horses are in the colour blue. Light blue (what you see on the graph) is specifically over the zones they survey. Being wild horse centered surveys, they are actively seeking wild horses and may not be searching for or documenting the other species present. While the dark blue is almost nonexistent existent when looking at the eastern slopes as a whole, the wild horses go almost undocumentable.
So again the dark colour is the overall species population in the eastern slopes, while the lighter shade will be only on the direct path of the aerial surveys. So we want to pay most attention to the dark colours as this gives us the best over all picture, while we want to look at the lighter colour to see what large grazing mammals are directly in the path of the helicopter wild horse survey flights. This tells us what % of populations are in the areas they are most actively looking for wild horses. So again this is the least accurate data, with no constant variable, inconsistent flight paths, but it does tell us what the government sees around these areas specifically. While again, dark colours give us a big picture of the whole equine management zones (including what is surveyed and what is not surveyed)
We will go through who is who quickly before we dive into what we see
Years are listed on the bottom, while numbers are listed on the right, every year having its on chart data for each species of large grazers we are studying
In this chart data
wild horses are blue, cattle are red, Elk are pink, Deer are Green, Moose are orange
- DARK = EASTERN SLOPES WHOLE
- LIGHT = SURVEYED FLIGHT PATH
-
So, if we look at the first chart as a whole, 2 colours should instantly pop out to you, consistently across every zone. Green and Red. Deer, again is green, and cattle is red. So right off the hop, we can see between 2013-2025, deer and cattle consistently stay as the top 2 large grazing species in the eastern slopes. This, matches what we see when we look at the large grazing species pies in our last research project for 2025. When we broke down each zone separately, we are now seeing deer and cattle are not just at the top in each zone, they are at the top year after year. Meaning cattle are consistently outcompeting Moose, Caribou, Mountain goats, mountain sheep, elk and wild horses. With 50-80% of grazing species being made up solely between deer and cattle.
Deer as we can see from this graph prefer dense areas typically away from cattle so while as a whole their populations are vast, on the flight path survey, they are less often seen, this can also be attributed to the lowest altitude flights scaring them before sight. While flight paths only check lower elevations. Less dense areas and areas “known to have wild horses” they make it seem as though so many wild horses are found, even though they are intentionally seeking them out.
Another good Aereal that should be done by the government is this- every 5 years they invest the expenses to do a whole scope eastern slopes survey with 4 windows seats in the helicopter (1 designated to fly, eliminated from counting) with 1 designated to count elk, moose and Caribou, one designated to count cattle and wild horses and the third designated to count deer, mountain goats and mountain sheep. They should start either the furthest point north or the furthest point south (brazeau or elbow( map out a grid that surveys the whole eastern slopes , and use that survey grid for flights year after year to keep consistent data. This would give us true population percentages and I want to make clear that until that point, when every species is counted in the eastern slopes is counted and surveyed as a whole, it is near impossible to have a full understanding, because trying to understand inconsistent data often leads no where. Which is why we point out how the survey is fixed to have high wild horse numbers, instead of survey the whole areas for all large grazers the single out wild horses. Even though when looking at this data as a whole in the entire eastern slopes, the wild horses make little to no significant impact ( unless around a salt block bait stations which does cause unnecessary damaged caused by humans, not the wild horses)
Next we will look at the eastern slopes only for the same years 2013-2025 and we will minus out the survey path, to see the broader picture year after year
-
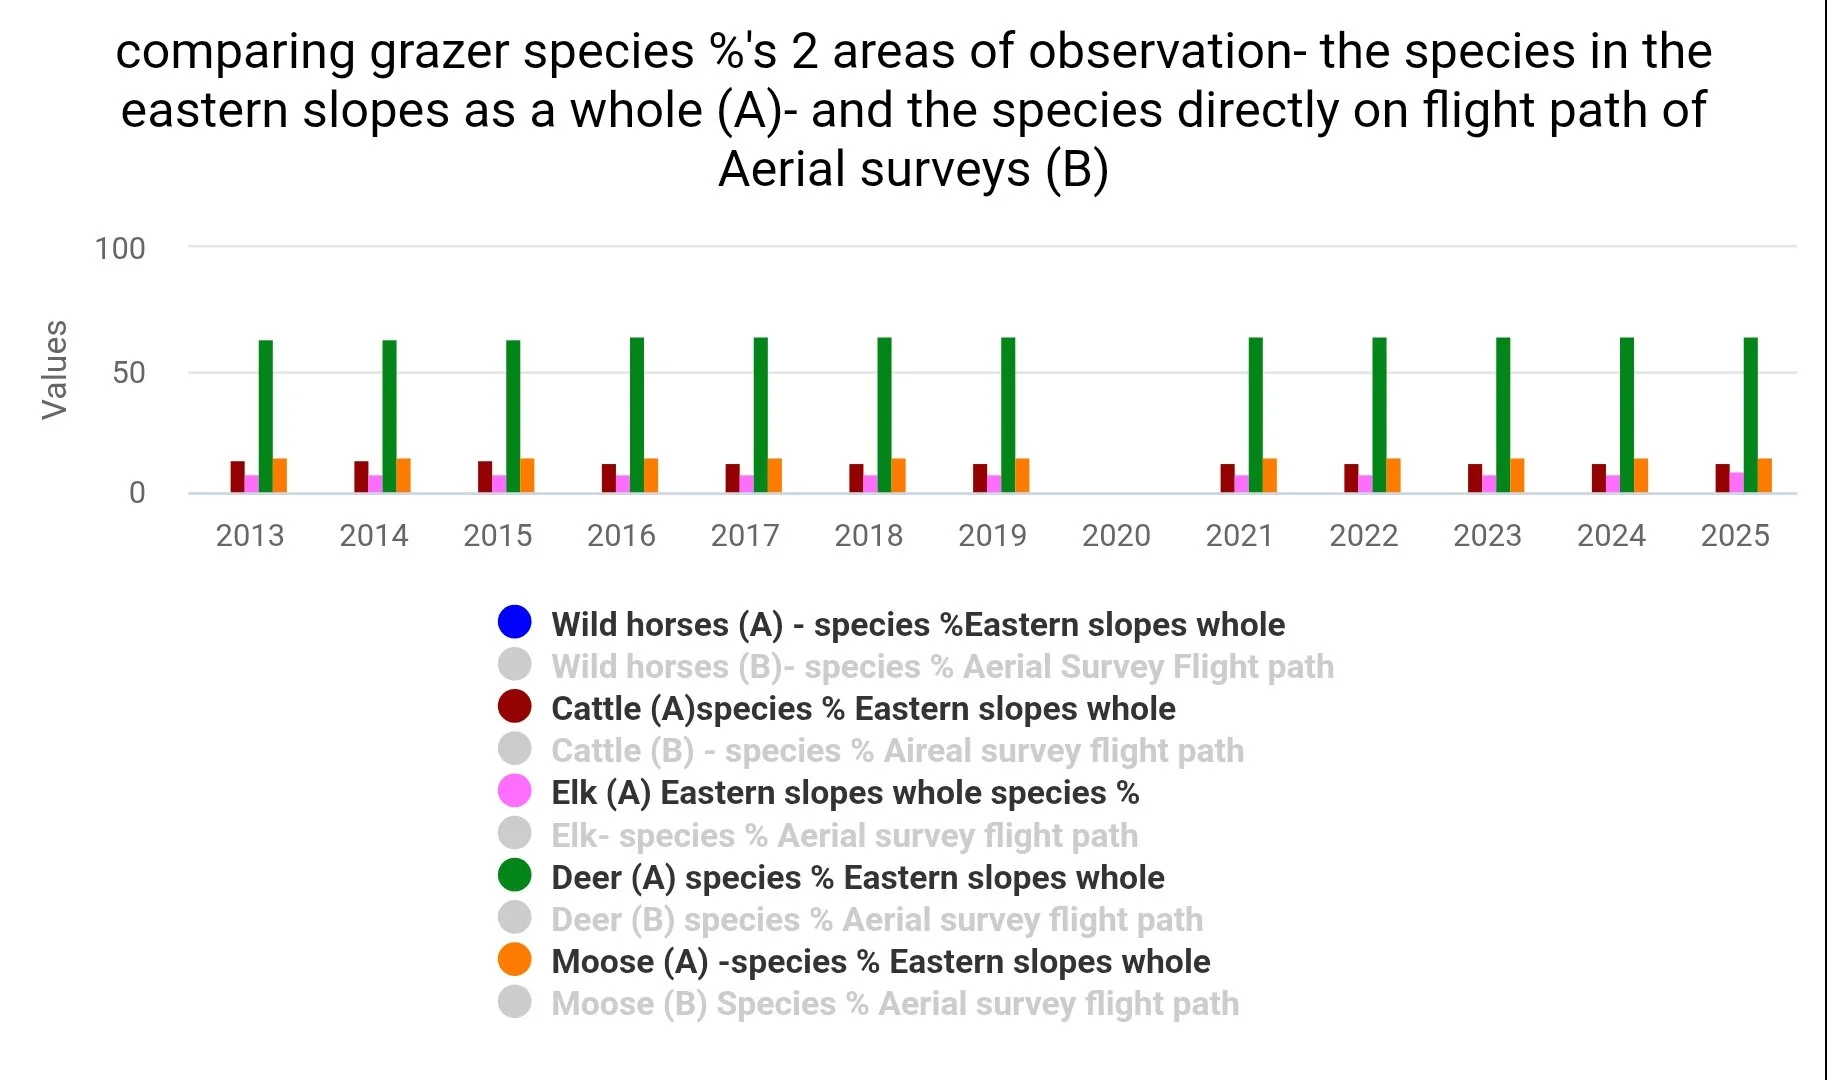
CATEGORY ' A ' ONLY ANALYSIS. 2013-2025 eastern slopes large grazing species as a whole
So this is what we see when we take out the survey flight path data. Let me know when you find the dark blue chart…..no? Us either. But we see something else here too. The cattle has now significantly dropped… meaning although they remain high, this clearly shows the majority of the cattle are in the area of the Aerial flight path surveys. If we know cattle have an over all population of roughly 60,400 head every year, the population looks very small when we look at the big picture , even with high names on the last pie charts, when we broke down the previous pie charts cattle was always 10-30% of the total grazing species population. This is because the cattle population is high, but they are mostly located near the areas of the government flight path data. This means in the eastern slopes as a whole we can now see the true “ over grazer” Deer. As a whole, moose do fairly well too, keeping their populations high and consistent through out the majority of the eastern slopes , unless around cattle, so when we see that overall cattle are in select areas in lower easier to access meadows, the moose thrive through out the rest of the eastern slopes. While wild horses remain almost invisible on the entirety of the Eastern slopes, even less so than the cattle, wild horses continue to always keep the lowest population numbers and percentages and still, they are the species attacked, even though they are originally native to this land and ecosystem (which we will get into in a later study)
Next lets switch over to the government’s controversial data. The flight survey paths, changing every year, new zones every few years, and different elevations, times and days. Making for very inconsistent data, but it is the data we have…so lets take a look.
-
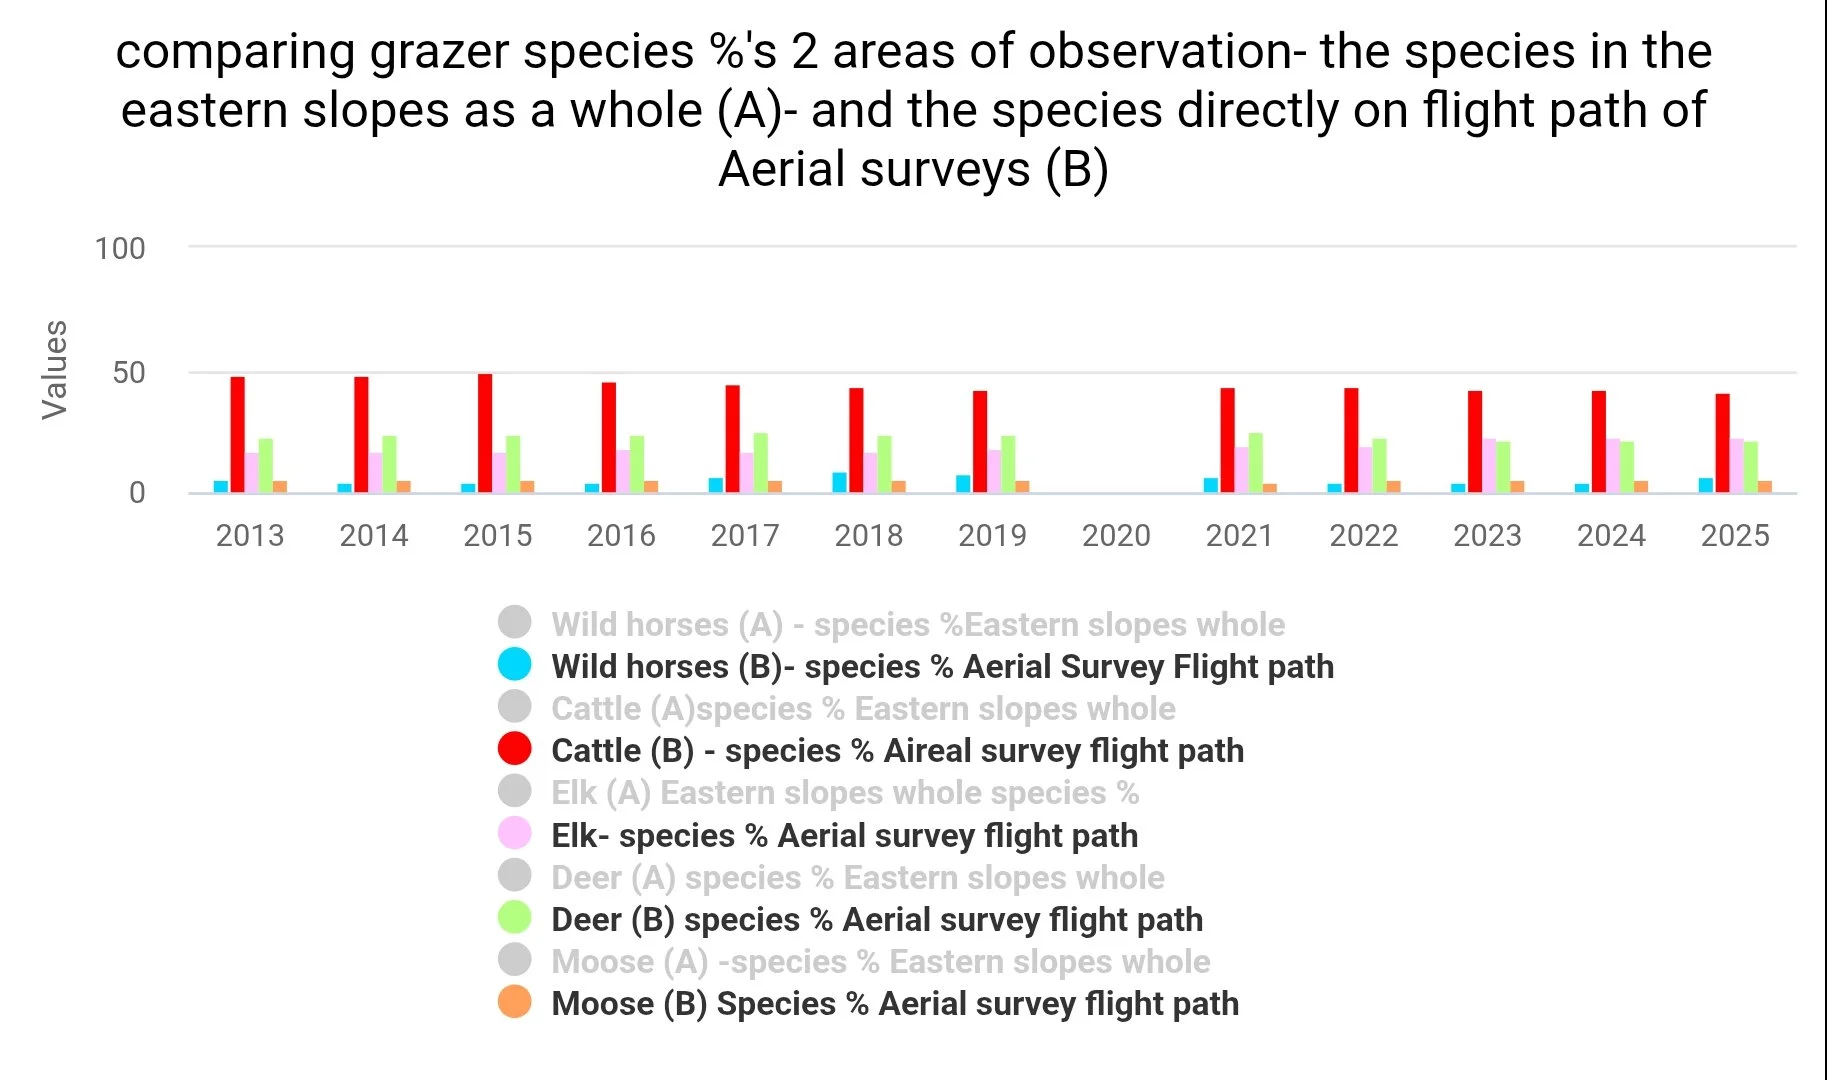
CATAGORY ' B ' large grazer species ONLY on the wild horse aerial survey grid path.
As you can see, things drastically change here, while our pies and eastern slopes whole, showed consistent data and patterns across the zones and years, when we look at the flight paths here, it’s a scattered chart of unpatternable data.
While one number stays consistently high here, many other charts fluctuate year by year but like always we can break it down and do our best to look for patterns, similarities and questionable findings and see what we get. All the colours remain the same (just lighter shades.)
So like we stated earlier, cattle go above and beyond even the deer species here. That is incredible, being the deer hold a steady 160000 head count in the eastern slopes, for cattle to over populate them, is quite the accomplishment…for the cattle ranchers. Essentially what we are seeing here is what the government, so while I do believe this is accurate, it is technically what the government sees when they do their aerial surveys, I do believe by doing this they block out the big picture of the eastern slopes as a whole ecosystem. So while I do think the zone surveys should be done and aerial surveys should be done, it should be done in a more consistent manner year after year. And they should be looking at each zone as a whole, every square mile, and the eastern slopes as a whole. Both relevant to understanding the wildlife ecosystems as a whole. And break it down to see each region on its own further. The most inconsistent data for the Aerial flight path, is the grid flight path changing. If you increase you survey area, you ultimately increase the species you will see. If we increase it one random year, on paper, it looks like higher numbers, when in reality the numbers haven’t changed, their survey and study variables are what’s changing.
So lets look at the little bit of info we can actually gain from this, in the areas the government survey, the cattle are the highest grazing species population. In the flight path zones. This is alarming. Or should be alarming to anyone who cares about the Alberta wilderness.
When our government is preferring cattle lease profit, over the health of our wilderness there is a big problem. The cattle in the flight path zones out number and over graze the deer, the moose, the elk, the caribou, and wild horses all. This is not to blame the cattle alone because we know when we look at the big picture deer are the highest population we see. Cattle are the second highest, while on the flight path of the government surveys again its cattle, this could be that cattle a domestic livestock are less flightful around helicopters, when the deer scatter it might look like cattle over number them. In both cases, cattle and deer are the two highest populations making them the highest competition for all other species of grazers.
The second highest species in the direct path of the government wild horse survey done yearly is deer, while they are drastically lower on the government Aerial survey flight paths, although cattle and deer still out populate all other grazers even if statistics say the deer are lowered here, as a whole they are still the second most populated species.
We then have Elk (pink). This is very telling. Although the flight path is “seeking out” wild horses, they are seeing more cattle, deer and elk than the wild horses. While many say the wild horses are pushing out the elk, we see that even in the areas they expect to find wild horses, in reality there are simply just more of everything else. Literally.
Next is moose, the only number that percentage wise along flight paths stays relatively low, in some years they’re a little higher percentage wise than wild horses, again you have to remember the pie data and where the flight paths survey, as a whole, moose out number wild horses. In Nordegg we see over 10,000 moose while only seeing 33 wild horses. So why does this chart make the moose populations look so small? Because of where the flight path is set to go, the grid pattern (or non-pattern) that they follow. Specifically targeting larger meadows at lower elevations (not the prime home of moose to begin with) when looking in these specific areas they are simply not looking in the prime moose territory. This is why moose populations seem low, also the highest species in the flight path grid is the cattle, and if you came from our large grazer pie data research, you will already know that there is a pattern for moose to stay away from cattle. So it makes sense when we see cattle being the highest population on their flight path, that we would see that pattern of low moose populations follow, this is not due to the wild horse populations that are significantly lower than moose and almost equal to moose on the flight path, this is attributed to the higher populated species pushing out the lower density species (cattle and deer pushing out elk, moose and wild horses)
And finally on this graph the lowest population….even though the flight path survey is designed to grid and fly the most populated wild horse areas, even when they seek out the wild horses, their numbers are still the lowest of all. Even in wild horse country, the wild horses are outnumbered by almost every species out there. They are definitely outraged land out numbered by deer, moose, elk and cattle. Caribou too have higher numbers than wild horses. Caribou sit around 1000-2000 receiving protection as “threatened” while our wild horse numbers continue to drop, culls and mini culls also known as captures, take place every year, then add in every wild horse hit on the road , every wild horse killed by predators and we have a species verging never coming back. With unstable numbers and unstable growth, and all the young stallions being removed, time feels short for the wild horses unless something changes. Let’s stop blaming the 0.6% of the grazing species for damage caused by over grazing. Lets look at what populations have the highest percentage impact on the ecosystem. Cattle and deer. If we want to fix the eastern slopes ecosystem, lets start by lower the number of head on cattle leases and start including cow calves in the head count because we all know calves eat grass too. Why? Because data wise and DNA wise, cattle are the only non-native species in this ecosystem. As many want to argue wild horses are not native, I urge you to research outside the algorithmic answers. They are wild their DNA is wild and this ecosystem was built to thrive with wild horses. And if we are still seeing over grazing lets look at decreases the cattle more. That is the main solution. Based on what the ecosystem needs. Now I understand ranchers fight hard to get rights to lease these leases. But the land needs to come above the beef industry. Next we need to remove every salt block off crown land, away from our lakes and rivers and wilderness. What a shame somwthing so detrimental to the land is allowed. This should be a huge red flag. Salt seepage is real and over 10 years of salt blocks being continually placed on the landscare is really starting to show its toll. Lets stop blaming the wild horses and start solving the actual problems with the ecosystem. And 100% it is not the wild horses 0.6% population accounting for the other 99% of grazing species damage. No wild horse eats that much. And finally lets start increasing the large and slow grazers natural to this land. Wild horses and bison. Which give predators slow young to feed on, while allowing the young or caribou, elk and moose to grow with less direct predator attacks and less forage competition from deer and cattle. This seems like two easily achieved