
Eastern slopes: Large grazing species population percentage analysis.
-
LARGE GRAZER SPECIES POPULATIONS PERCENTAGES- EASTERN SLOPES "BIG PICTURE"
If we look at the eastern slopes large grazing species populations as a whole, it becomes clear what grazing species hold dominant presences in this vast wilderness
We have 7 pie graphs to go through today looking at the large mammal populations in the Eastern slopes
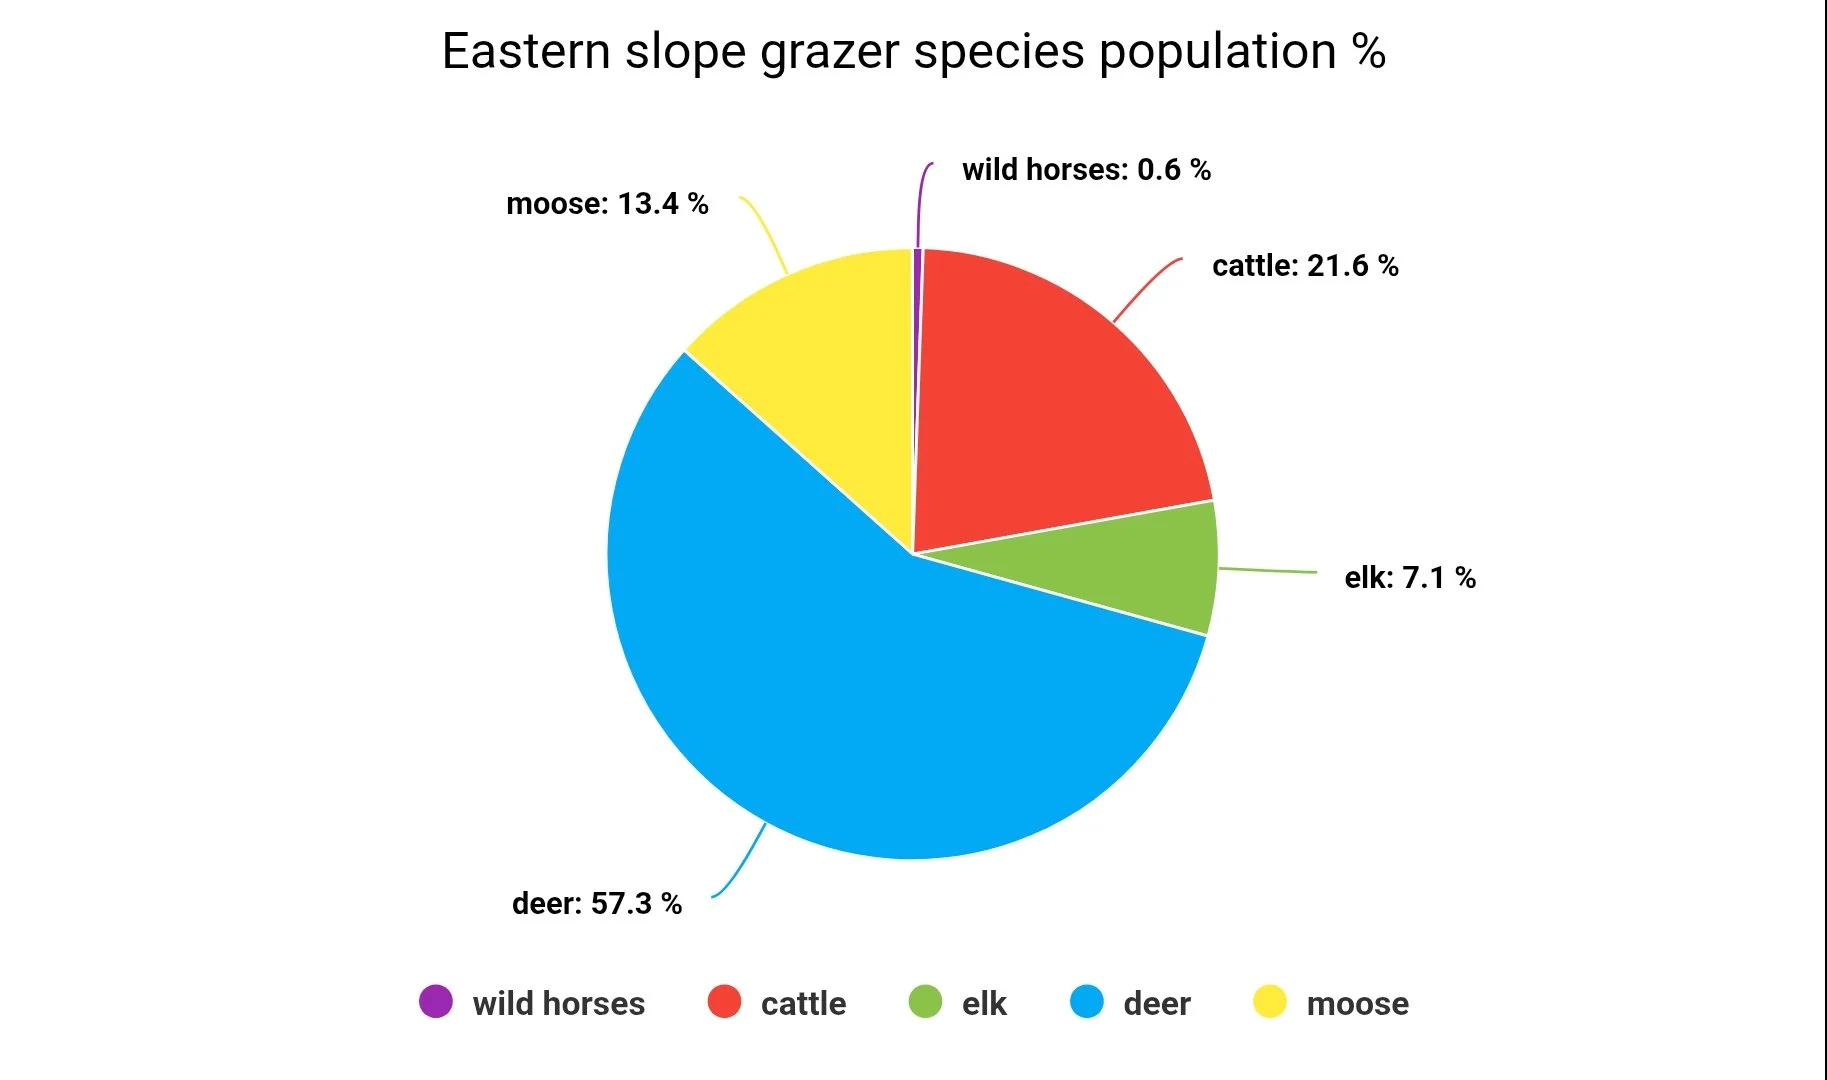
Highest population to lowest percentage + head count total in the eastern slopes
Deer: 57.3% "- 160,000 population total
Cattle: 21.6% '- 60,400
Moose: 13.4% - 37, 400
Elk: 7.1% - 19,900
Wild horses: 0.6% -1536 population total
To put that in perspective, in the eastern slopes only, there is about 100 deer per every wild horses, as well as 14 cattle for every wild horses.
The wild horses have the smallest population of all Large grazers in the eastern slopes. The exception? While Alberta's Caribou population is critically low, estimated around “2000” total, it is deemed threatened, granting them protection in Alberta to safely grow their herd numbers. The main culprit for Caribou habitat loss is said to be, oil, gas and forestry related industries, pushing the caribou out of their natural habitats. So why would I bring up Caribou if they are not on the pie graph charts to begin with? Because when we compare the Alberta wild horse to the Alberta Caribou, we begin noticing patterns emerging. While the Caribou have been granted a beautiful right of protection for being deemed a threatened population, it is worth mentioning their province wide population is greater than that of the wild horses. 2000 Caribou recieve protection, as threatened, by having what is deemed as critically low populations, while the wild horses, with even lower number, recieve little to no protection, no threatened title, and a government saying the wild horses are skyrocketing and outcompeting other species. The little population, which, at these low numbers, would be concidered threatened if they were any other species. How could 1400-1500 wild horses possibly be the cause of ecosystem damage id they make up less than 1% of all wildlife who eat forage in the eastern slopes. The science regarding the matter does not make sense.
What this tells us- the wild horses who eat the grass and forage make up only 0.6% of all grazing species in the eastern slopes. This means the cattles biggest forage competition is the deer, moose and elk.
As you will see further in our data, the moose prefer dense forests away from cattle, doing the best in cattle free areas. It seems as though the moose are being pushed out by the cattle, not the wild horses.
While the elk show a unexpected statistic, since 2013 the elk and wild horses seem to cohabitate effortlessly. Elk numbers go up in areas with high wild horse presence. And elk seem to be migrating into the areas with wild horses, perhaps the wild horses give them safety in numbers in the even that wolves or cougars set in on a hunt, if theyre near a herd of horses, they have better survival odds (they get away easier)
So while Biologists, Ecologists and Agrologist are worried about the wild horse populations “skyrocketing” in realty, they make up a fraction of the grass eating species, specifically the large grazers.
In valleys and meadows it appears the cattlss biggest competition is actually the Elk. Elk thrive in these lower valleys that the cattle are leased and grazed on. The wild horses pass through these grazing meadows in the summer, but they prefer the high mountains and steep valleys in the winter, and they naturally migrate through out the summer (that is as long as there are no salt blocks or bait stations anchoring them to a specific area)
Now let's dive further into this topic, let's break down each zone and the total large grazer species percentages from each of the 6 wild horse equine management zones
-
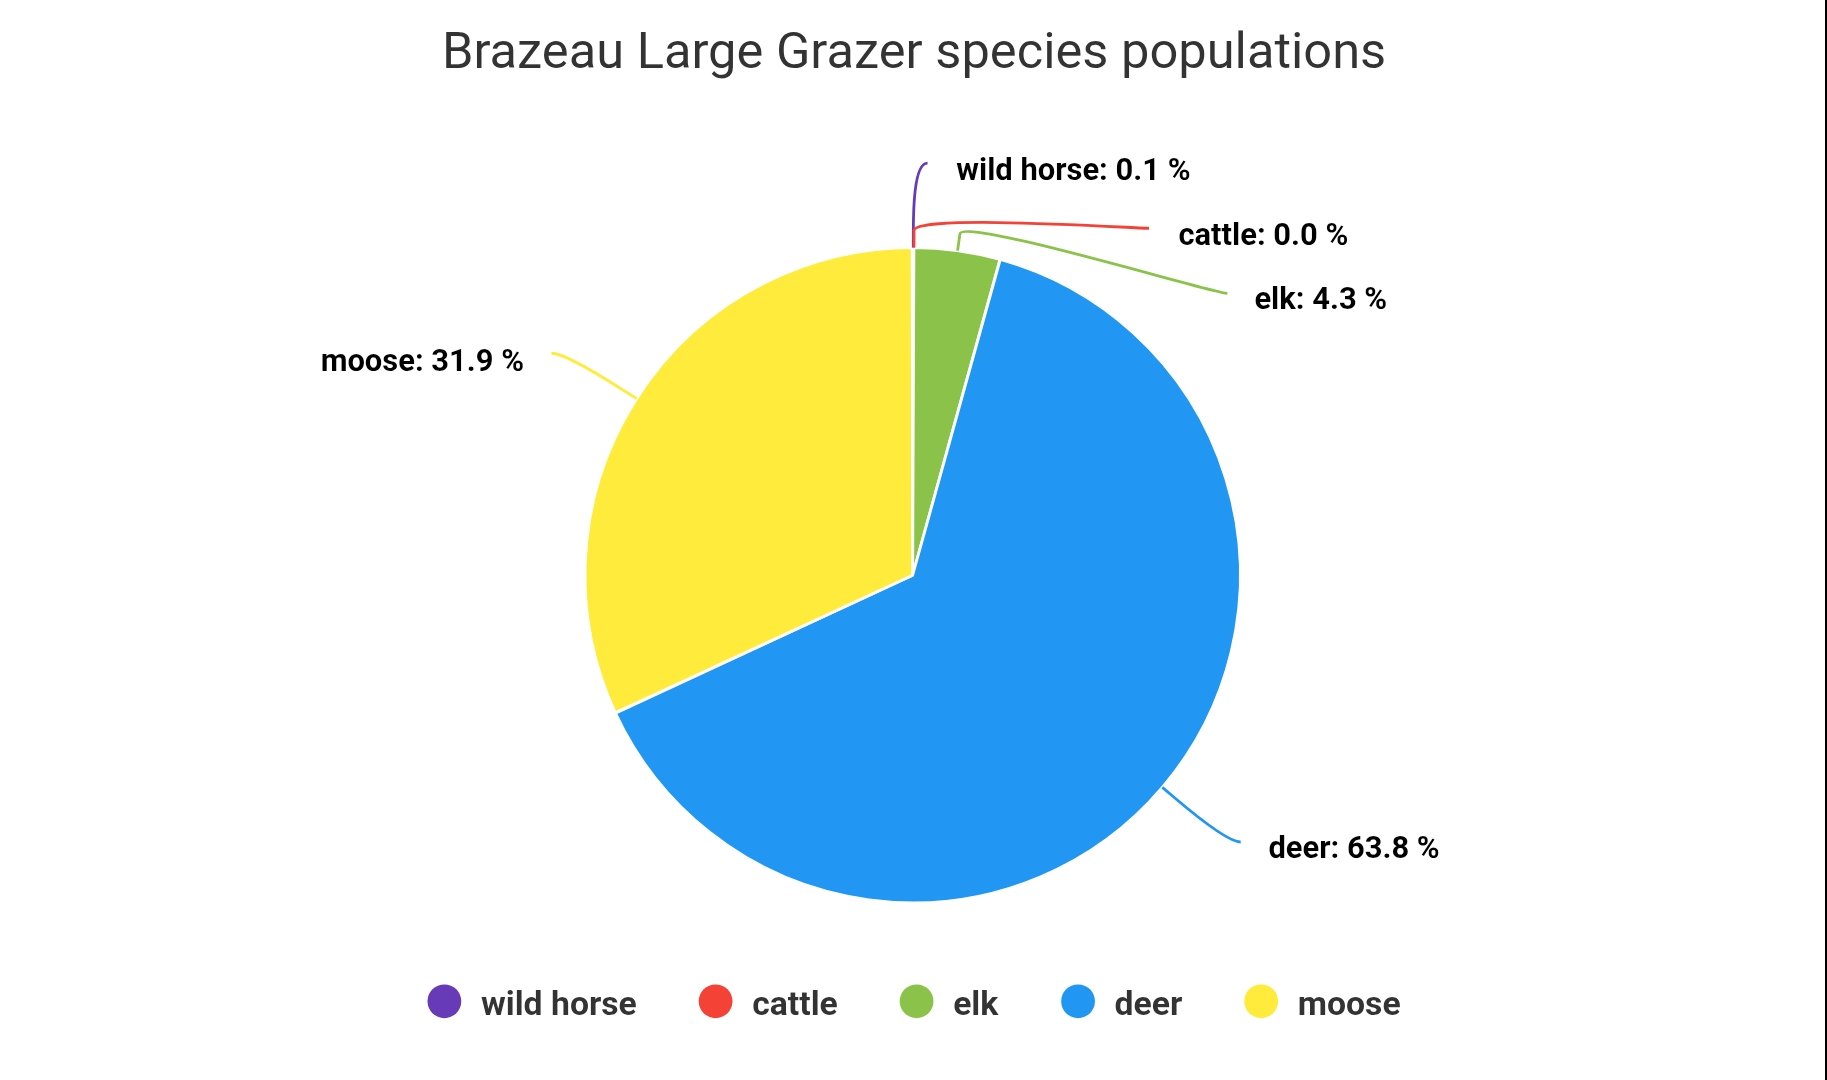
BRAZEAU EMZ: Large Grazer Species Population Percentages in this Emz
When we look at Brazeau county and EMZ as a whole we can start to see the data making sense. And it sure does not match what we are being told. We will look at each population and break down what we find as patterns. We will do the same break down for each equine management zone within the Eastern slopes. We will start with the highest (most dense) population, and work our way down to the lowest grazing population for each zone, stay with us as the next 6 pies show some incredible data. So again I just want to say we are not professionals we are simply doing this to try and find the answers we are looking for, because we are looking for these answers, you may be too, so we will share all that we find. However with that said, when I look back at this study now, I realize I should have included 3 other species to this pie data. Caribou, mountain goats, and mountain sheep, although their populations are small they are large grazing species in these zones, so we may do an updated version later down the road to include those 3 species to the data. For now we will look at the main species present.
Deer 63.8 %
Moose: 31.9 %
Elk: 4.3%
Wild horses: 0.1%
Cattle: 0.0%
So we can clearly see around Brazeau a booming deer population making up well over 5o% of all grazing species in this zone, this is consistent for deer pretty much across the board staying between 30-60% in each zone.
Next we have Moose. Surprisingly in Brazeau country Moose have the second highest population density/ percentage with over 10,000 Moose in this zone, it makes the 18 gov. Counted wild horses look like pie crumbs. With over 500x more moose than wild horses, it makes it hard to believe the 18 wild horses are out competing any species in this zone.
What we find next is the Elk population surprisingly low here. But once we start looking at every zone, we can start to see a pattern in when and why the Elk population drops and spikes. In this zone, from what we have gathered, Elk prefer lower elevations, with more open meadows to graze, while Moose prefer dense forests and do not mind steep mountain terrain. The Brazeau zone is as dense as it gets with the main culprit being logging and replanting trees so jammed pack with trees, it makes a tight and difficult terrain for large elk herds who gather in large groups, making this notice an ideal landscape for the elk, while they do exist here, about 1200 of them, we will soon see where the elk do best.
Next-the cattle. There are no cattle to blame here. No cattle lease ranchers to blame for private removals of wild horses, the only removals that happen here are capture permits or LIS (livestock inspection service) removing wild horses they deem too close to roads or public areas. So while everyone is arguing about who to remove (cattle or horses) it seems in this area, the deer and moose took the lead in the forage ecosystem. On the odd year cattle leases exist here, they are in small amount almost untraceable amounts, similar to wild horse populations. So while we can all agree some areas are too densely stocked with cattle, Brazeau is not one of those areas.
And finally for Brazeau- the wild horses. We can see the population at 0.1% meaning the wild horses do not even make up 1% of the population, statistically their numbers are so low it is closer to 0% that 1% of the total large grazing species in Brazeau. So while the cattle are certainly not to blame here in Brazeau, neither are the wild horses. If over grazing is occurring in Brazeau, the moose and deer populations should be the first looked as the culprits here.
We can not pick one species to blame entirely that would be unfactual and unscientific. We need to break things down, see the details, and then build up to the big picture.
Next we will look at the next adjacent zone, starting north west of Alberta in Brazeau we will work our way down south, the next zone, is Nordegg, lets see what we find from that data, amd continue looking for patterns and links
-
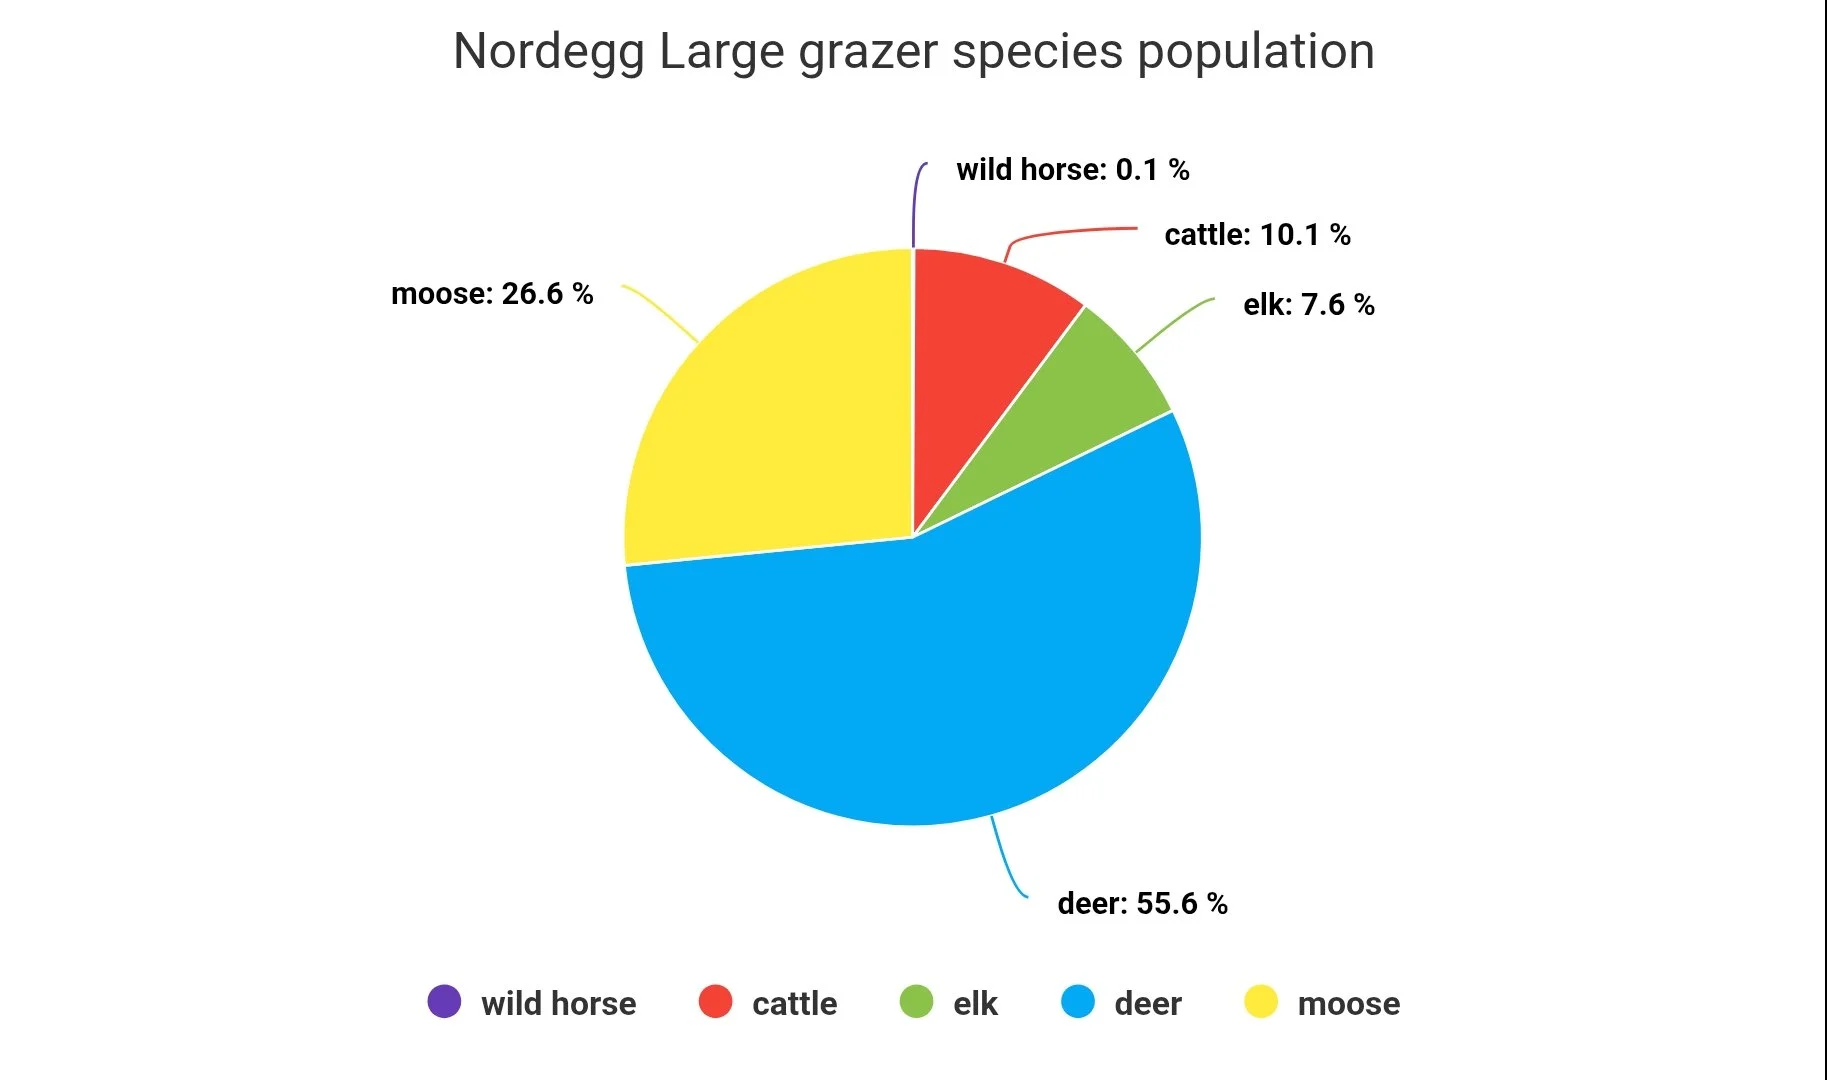
NORDEGG- Large grazing species population percentage break down
When we look at the Nordegg zone and compare it to the Brazeau zone, we start to see some interesting things. To start this zone is still fairly dense, many logging routes and replanted areas, steep terrain and dense forests, but in the valleys below are nice open meadows making it good grazing land for larger herd species.
Again we will start from the highest population percentage down to the lowest.
Deer: 55.6%
Moose: 26.6%
Cattle 10.1 %
Elk 7.6%
Wild horses: 0.1 %
This is where we can start seeing the patterns take shape, lets start with what we see in the deer data:
The deer presence remains relatively high in this zone, although we can see the population is slightly lower than what is was in the previous zone. Going from 63.8% of the population to 55.6%. , so, All data can be deceiving if not done transparently, when looking at percentages we see the Deer population seem to drop, while when we look at numbers the herd population actually increased in this zone, while the percentages decrease, this is why we include multiple grazing species, although the deers population increased, because other species populations increased at higher amounts, their total percentage in the area went down. So this data told us we needed to do number charts and pies too not just percentages. So the number data will be further down, the next data inconsistency we notice when doing solely the pie chart in the zone as a whole, we are seeing the true numbers, well, we realized this can also be broken down into whole zones vs only the head counts that are directly in the flight path of the aerial surveys, while this shows us a total, breaking down populations on the government flight path helps us look at their perspective and try to understand what they see in species populations when they fly, so stay tuned as we dive into both these other research studies further down,
Let’s continue with what we see in this study first, next we have the moose. Moose hold 26.6% of the total grazing soecies population in this zone, while again the percentage indicates a herd count drop, when looking at the population numbers we can see the moose too, increased their populations even though their percentage in total grazing population went down.When trying to understand this data we have to keep in mind one important factor, if a percentage goes down it is because of 1 or 2 things. 1 being the number/headcountt went down. Second would be the other populations spiked, lowering the percentage on paper regardless of the number/headcount. The second option is what we are seeing here. Although in realty , deer and moose populations are higher here than in Brazeau, because other factors also increased, at higher rates, it was unnoticeable on the pie graph alone, again, why we are breaking down each area of research over time. So back to the moose- it is also important to note that this is the zone with the highest Moose populations. When comparing and analyzing data from all 6 equine zones, Nordegg is the preferred moose range. While they are located in all zones, this has the highest head count for Moose.
Can you recall what was the third highest mammal in Brazeau? That’s right Elk. But that is no longer the case here, when we cross the imaginary border into the Nordegg zone, we find elk no longer have the third spot on the forage food chain. Although the Elk population and percentages both increased, another species popped up with a higher grazing head count.
The cattle. In Brazeau the cattle were an unmeasurable statistic. Across this imaginary line, the cattle leases pick up, now making up a total of 10.1% of the total population of large grazing mammals here. The cattle went from unnoticeable in Brazeau to 10% of the species who graze in this area. This is why we see Deer and Moose percentages drop while the head count goes up, in Brazeau it went from basically 4 large grazing mammals to here in Nordegg having 5 top species who account for the majority of grazing and foraging. So what we can gather from this percentage wise, when cattle populations spike, Deer (white tail and mules) spike… although, in a later study we will see if there is a difference in zone preference between the two Deer species for now we are looking at all Deer as a whole. And like wise when cattle percentages rise, moose population percentages typically take the worst hit, Showing us that between the Deer, elk, and moose, the moose seem to be the most affected by the cattle population. We will get to why shortly.
Next to look at for nordegg is the Elk population percentages. So, while we mentioned this a bit early, we noticed a pattern emerge that we were not expecting to find. It goes against so many studies and research finds over the last 50 years. Many studies suggest Elk are loosing habitat due to the wild horses. These pies start to paint a different picture though. A common theme through these 6 equine management zones is that when cattle populations increase, so do the Elk populations. Elk appear to have a commonality with Cattle. Both graze in larger sized herds than most other foraging mammals, and both, prefer lower elevations with larger open meadows. This makes cattle the main forage competition for Elk, and likewise, Elk are the cattles biggest forage competition. The next thing we can gather from this chart data, is that there could also be another reason to why Elk populations spiked around cattle, first like I said, cattle are placed in areas that are already favored by the elk, but the cattle bring an additional protection to the Elk as well, when cow calves are out there in the hundreds, the wolves, bears and Cougars have more choice of prey, with elk running fast, cow calves are a much easier prey than elk calves. Giving more elk offspring a chance ti grow up, increasing their population numbers. So the cattle can be a win loose with the elk, loosing prime meadows to cattle, they gain protection for their offspring through additional numbers of prey species.
Like I said, we have no bias here. We are simply looking for truth, facts, and data that makes sense. While we see many negatives with cattle and their leases, we do have to point out all the data we find, and that includes noting any potential benefits as well.
And finally on to the wild horses. The reason we do this research, wild horses will be shown in purple for all pie charts in this 7 pie study. On a pie graph, once compared to the other grazing species, wild horses again, are almost nonexistent in percentages. While we watch elk, deer, moose and cattle populations fluctuate and increase, the wild horses remain low in number and percentages. In Brazeau a total count of 18 was done, in Nordegg a total count of 33 was done. Again, we go off the government Aerial survey numbers for legal accuracy. Check out our ID files to know how many wild horses we really find, our zone chart is in the works and will also he released shortly.
what we can gather from this data is that with and without cattle, the deer, moose and elk populations stayed steady around wild horses. While cattle percentage changes seem to cause all other populations to fluctuate. Moose seem to do well around wild horses, while they see significant reductions in high cattle zones, elk on the other hand, see steady levels around wild horses, and drastic increases around cattle. Seemingly unbiased by wild horses, however there is certainly more to be looked into between the ecosystem dynamics and population patterns between cattle and elk. Elk like having extra protection in numbers, but it comes at a huge forage cost, sharing all their prime forage with the cattle.
This is what we have found in the Nordegg zone, lets check out the next Adjacent zone, Clearwater, and see if the same patterns continue, or if perhaps more.patterns emerge
-
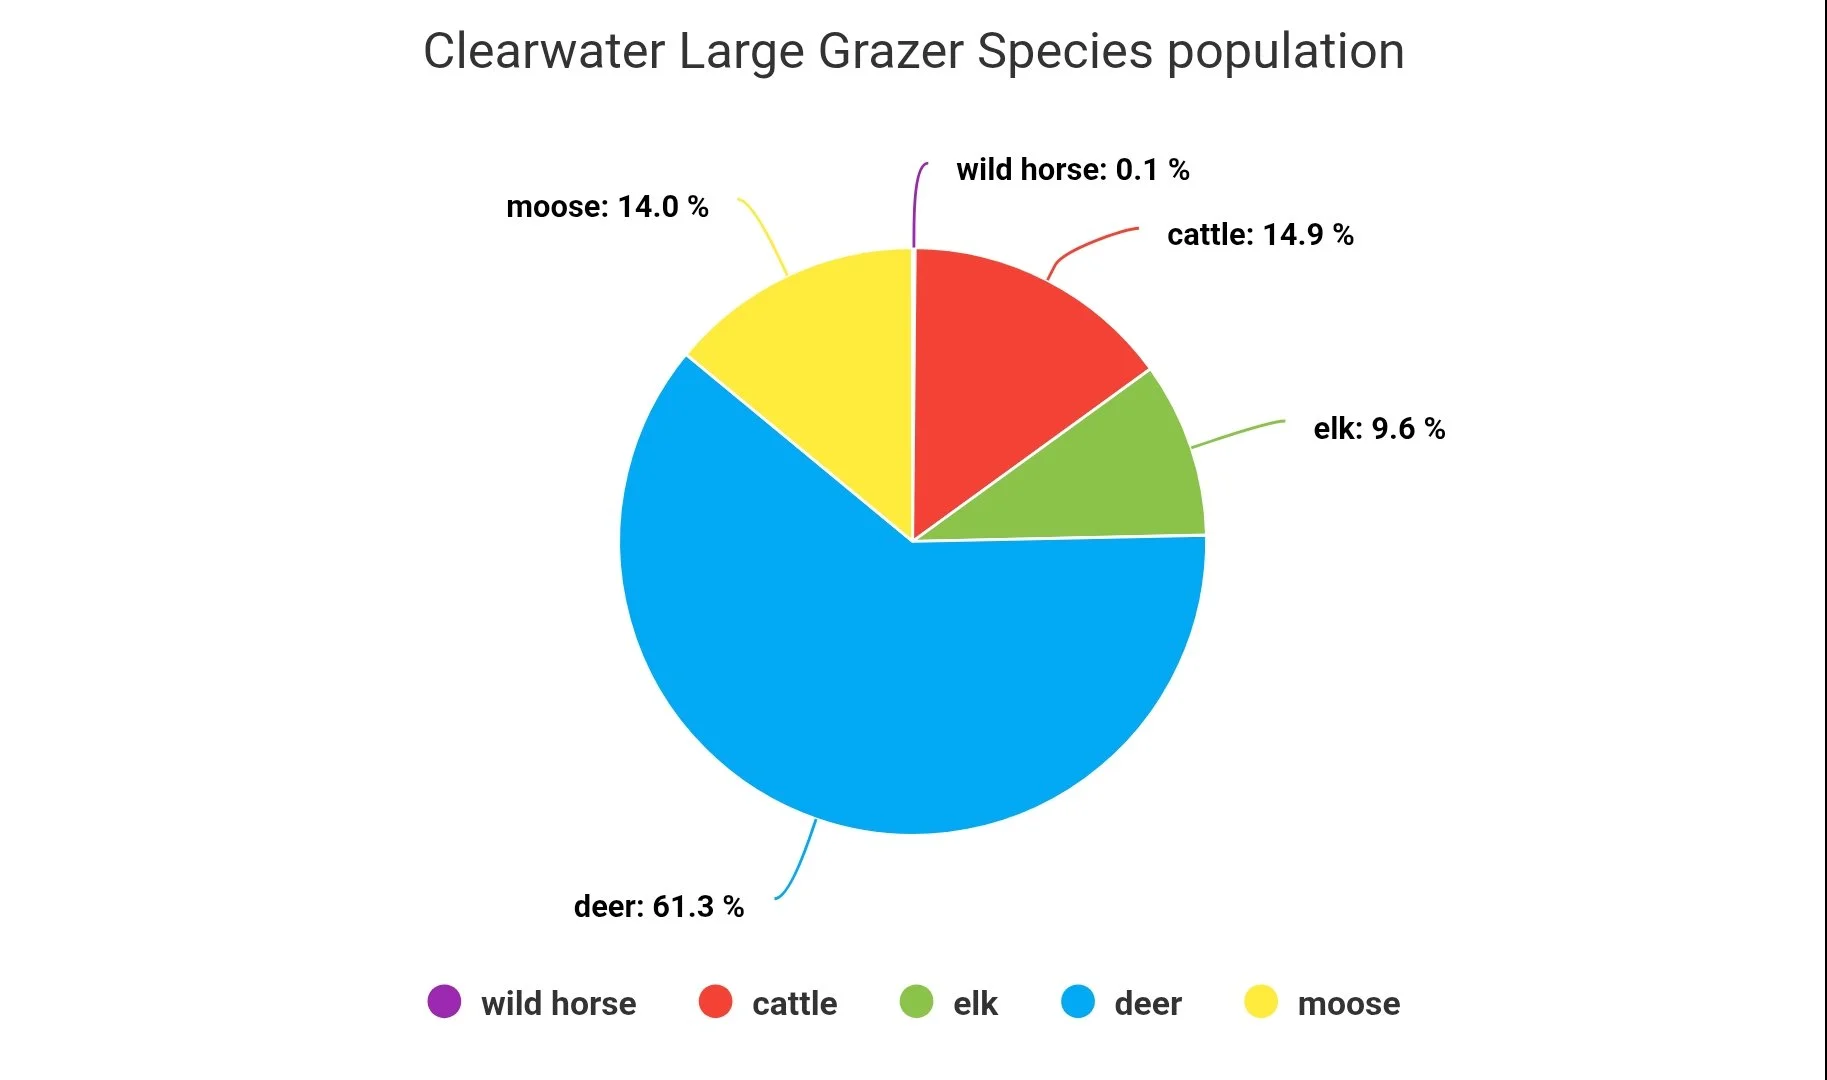
CLEARWATER - Large grazing species population percentage
This is the Clearwater Equine management zone. As it appears, the patterns continue. So lets break it down from highest to lowest population percentage again:
Deer: 61.3%
Cattle: 14.9%
Moose 14.0%
Elk 9.6 %
Wild horses 0.1%
Deer, yet again are at the top of the forage food chain in the Clearwater zone. Now verifying in at least 3 out of 6 zones, deer hold the highest total head counts. Like we stated earlier, deer show little to no preference as to who they share the land with, they have adaptability unmatched by any other grazing species. They thrive in the lower and higher elevations, they thrive with cattle, wild horses, elk, and mose. While year after year disagreements occur on who is outcompeting who (wild horse, elk or cattle) it appears the real forage king is the deer. With white tails taking the greater % mules hold up close behind. Both being above all other species.
Next in Clearwater is cattle. To understand the geography and landscape here, we started with Brazeau, the most northern Ewuine management zone, working our way south, with every zone being a little further south than the last. This is an important detail when looking at the pies in this study. So as we go further south, we see the cattle populations increase in percentages and numbers. This is the second Highest cattle zone. With approximately 35,000 head placed on the crown land leased out to ranchers every year in this zone. What we can see from the pie, percentages and numbers, is that when cattle percentages go up, moose always take the largest population drop. We went from an order of Deer, Moose, Elk to now Deer, Cattle, Moose, Elk. In Clearwater the cattle outcompete both the moose and the elk, statistically speaking.
So lets look at Moose a little more. While this land further south gets a little less ideal for Moose, approximately 8000 still call this land home. While it is not the zone with their highest numbers, they do still thrive here in high numbers, although they appear to be most outcompeted by cattle, preferring ti migrate away from cattle dense areas.
Next we have Elk. The odd pattern continues with elk here. As the cattle numbers and percentages increase, again so do the Elks. This is the highest zone fir Elk population with at least 5500 documented here. Although their numbers remain fairly low for a wild species, increases are apparent in zones with cattle, and when cattle percentages spike. We have to note this may not be due to them liking the cattles presence, it may infact be a simple overlap of preferred grazing meadows. If the Elk are typically present in these meadows, cattles presence could just be highlighting the fact that both species graze the same areas specifically. This could make Cattle the biggest competition to the local Elk herds. Also making Elk the biggest competition for cattle leasers.
The final study in Clearwater, also the alowest population for large grazing mammals in Clearwater zone is again, wild horses.
The purple pie (the wild horses) population percentages are still, almost unmeasurable on the pie chart. With a small purple line being the only visible evidence of their herd counts. The wild horses make up 0.1% of grazing species populations in Brazeau, Nordegg and now Clearwater too.while we see many species percentages fluctuations, the wild horses remain steadily low, to the point of being almost undocumentable in percentages. This is why the big picture is so important if we say “wild horses populations doubled” what does that really look like on paper, and in data? Statistically speaking, even if the whole eastern slopes wild horse populations doubled (for example from 1500-3000) they would still remain around 1% of the population (1.2% of total grazing species) so while when we hear “wild horse populations doubled” it can sound quite alarming, and drastic, until we put that data into comparison with the grazing mammals as a whole, to see that even if their populations doubled, when compared to the other grazing species they leave minimal impact.
The two biggest grazing population percentages in clearwater are in fact Deer and cattle.
Next we will look at the most argumentative and controversial zone in regards to wild horse populations. Sundre
-
SUNDRE- Large grazing species population percentages
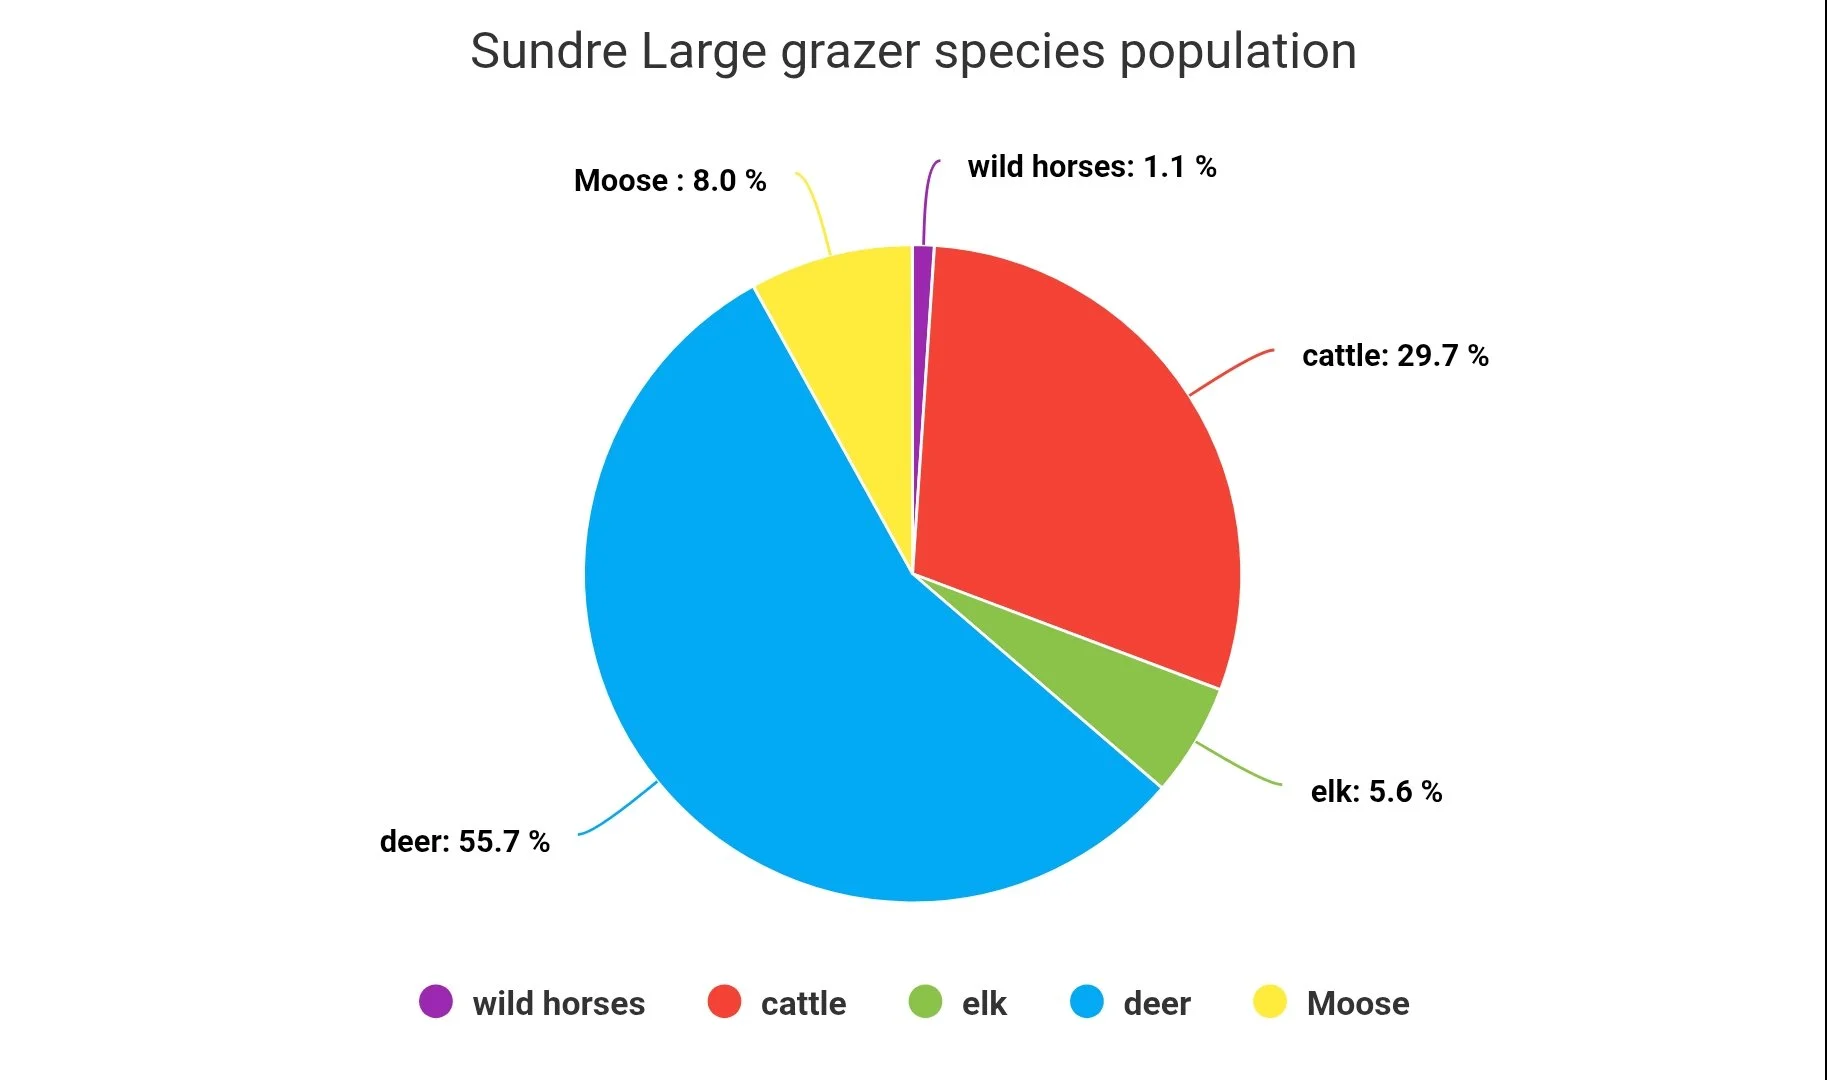
This is what we are seeing when we look at the most controversial equine management zone. Percentages being very telling here. We will again start by the biggest presence in percentages doe to the lowest
Deer: 55.7% remaining at consistently high populations. This zone overall has the highest head count for deer out of all 6 zones. Approximately 45,000 deer roam and graze within the sundre zone.
Cattle 29.7% remain at the second highest spot for species population out of the 5 in question.
The cattle population spikes in this zone in compared to the last, showing a steady sign of increasing as we go south.this is the highest head count for cattle out of all 6 zones.
Moose: 8.0% as we see cattle percentages go up, we see moose percentages go down, Moose seem to show clear avoidance of high traffic cattle zones, while they remain fairly high in numbers (around 6500) The zones further north are their prefered habitat.
Elk 5.6% we see the population total decrease here, due from just leaving the densest elk zone (clearwater) this is still the second highest zone for over all elk head count. The three zones with the highest Elk populations are also the zones with the highest cattle numbers this is also the highest zone for wild horses as a head count, (not as a percentage) with an estimated 855 wild horses in this zone, we see that cattle populations seem uncovered by the wild horse populations and seem to do better with other large grazers that help keep Predation attacks directed at the elk low, when they have cattle and wild horses to help feed the predators. By numbers and statistics cattle deer and elk are the three species competing to be at the top of the forage food chain. 1 species (cattle, not having ever been native to north america, true livestock) should be the first population reduced. As they are livestock they should not out forage the elk and deer. If cattle ranchers want to increase their cattle head, the best and most productive method would be to increase hunting tags for the deer species, as deer remain at the top of the forage population. The wild horses. Even in the zone with the highest head count, still only accounts for 1.1% of all foraging species on the land in this zone. The elk, prefer the lower grazing, while wild horses migrate up and down the elevations through out the season. Cattle remain at lower elevations, making cattle the biggest threat to the elks forage and resources.
Which leads us back to the main data we are looking for. The wild horses. With Sundre being the “tourist zone” and the highest wild horse head count zone, the wild horses remain steadily low at only 1.1% of all large grazing species. Soon we will put together a chart with all grazing species big and small and gather the full over all population percentages of wild in comparison to all other species that graze. What we can see from this data, that if ths elk were bothered by wild horses, they would not both be thriving in this zone. The only species significantly reducing the total grazing populations of other species is the cattle. Chart by chart it makes it clear to see the wild horses are not responsible for the degrading ecosystem (if it is really degrading ) the main species we would look at based off the population totals would be the Deer and the cattle, only one of those, being an unnatural species to this ecosystem. The cattle.
We have 2 zones left to look at in regards to total grazing population percentages when compared to the other main large grazers. Ghost and Elbow. Both come up quite frequently in our research to track down wild horses going through the auction system. For anyone curious we are finding links back to sundre, Ghost and elbow zones most frequently with “nuisance” removals. So lets take a look at the next zone south – Ghost. Another highly debated equine zone
-
GHOST-large grazing species population percentages
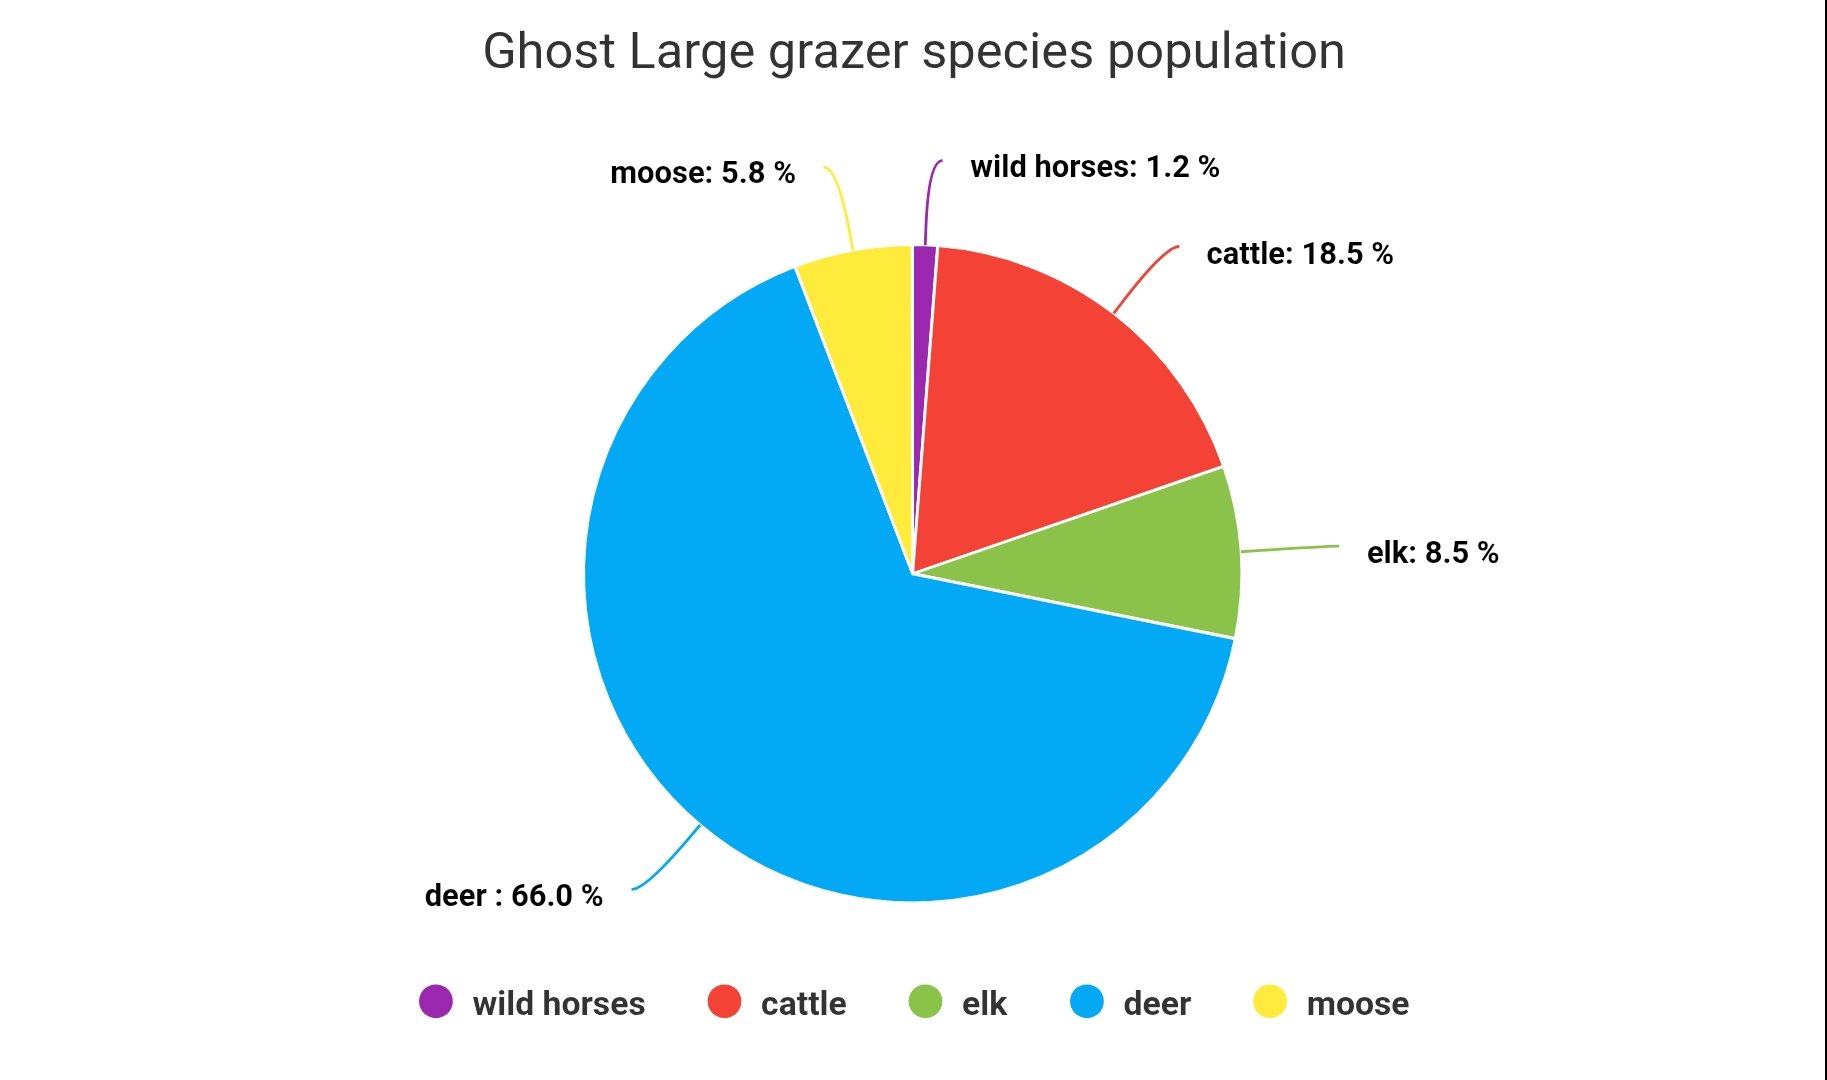
This is what we see when we put the Ghost grazing species into a pie chart based on population percentages in that zone. We will again start from the highest to lowest percentages
Deer: 66%
Cattle- 18.5%
Elk: 8.5%
Moose: 5.8%
Wild horses: 1.2%
Again we can see, leading this zone is the deer. Over 60% of all larger grazers are deer in the Ghost zone. While cattle hold steady at second, so not only do deer rank high as a whole, they have the forage monopoly over every other large grazing species.
Next we have cattle, the second highest population total in the Ghost zone, outnumber both the elk and moose populations. While wild horses are removed from the Ghost and sundre zones yearly, the cattle hold high in the ranks of grazing species, even though, they are the only species unnatural to the ecosystem, their populations continue to rNk among the highest, in every zone, but Brazeau. While wild horses are natural to the original north American landscape and ecosystem, cattle are not. The closest species in north amerca to the cattle are bison. If we wanted to produce meat on crown land, without damaging the ecosystem, bison would be a much more sustainable method, being they already have a history with our ecosystem. Regardless, we feel like the livestock should not out number the natural species. While many would say “ then wild horses need to go too because they are livestock” we disagree. The original wild horse originated here in North America. The wild horses have always had a place in north Americas ecosystem. Naturally. While livestock leased cattle outnumber the moose, elk and wild horses greatly.
The next species in Ghost zone ranked below cattle are the elk. We can now see the pattern between the cattle and elk. Elk in this zone, have outranked the moose. The next noticable detail here is this (percentage wise) is the largest population of wild horses in comparison to the other large grazing species in this zone. So elk and wild horses appear to both cohabitate very well amongst each other, while elk and Caribou prefer the larger meadows , wild horses and moose prefer the smaller cut blocks and hard to reach meadows amongst the valleys and dense forests. This is the second highest percentage of elk when compared to other species, although their head count is lower here, they do make up a larger percentage of the over all grazing species in this zone so while we see an increase of elk % when cattle populations go uo, this can partly be attributed to moose populations going down, and as a chain effect the elk goes up. Again showing that Alberta’s moose population appear to be fairly bothered by cattle presence. While the cattle compete with the elk on the lower and larger meadows. Elk cattle and Caribou prefer large herds needing large meadows to stick together and not get separated. While deer, moose and wild horses keep small herds easily maneuvering together through dense forests and smaller meadows. The eastern slopes is a chain and cycle of wildlife that the 1% of wild horses as a grazing total, have very little impact on, and no negative impact can be linked directly too the wild horses through this data. So while I touched briefly on what we see with the elk moose and wild horses , the moose take the second lowest ranking here, being pushed out with high cattle and high deer percentages,
Then the wild horses maintaining just a little over 1% of the total large grazing soecies here in Ghost emz, (1.2% ) the highest percentage base flr the wild horses (Although head counts are higher in sundre) they make up slightly more of the total grazing species in the Ghost zone. However, when we look at this in true data, the wild horses still only accounts for 1.2% of the large grazing species 99.8% of the large grazers are deer, cattle, elk and moose. Essentially we blame the population with the lowest population density and blame them. Ignoring what the true data tells us. That deer are the majority of grazers. Cattle outnumber the elk and moose, they over compete for the lower range meadows that elk prefer (and caribou) and mathematically, the moose fleet from cattle density. While everyone species remains fairly steady around wild horses, who remain only 0.6% of the total large grazers in the eastern slopes.
Let’s now look at the last equine management zone. Brazeau and elbow both being the least talked about equine zones, while elbow seems to have quite a few wild horse removals around sheep river. Do to recreational safety hazards? Essentially. Humans enjoy hiking here so we remove the wild horses to cause less of a safety risk to the tourists. Do we remove bears from crown land too? Elk? Moose? Or do we tell hikers and wildlife enthusiasts to keep them selves safe in the outdoors,? Use precautions and don’t approach wildlife…right? Not in Elbow zone. No. The wild horses are removed to keep the safety of recreational users. So lets have a look at the data in Elbow and see what we find.
-
ELBOW EMZ large grazing species population percentages
So this is the pie graph we made for what we found on the Elbow zone large grazing species population. with all the data we have collected we are taking some time to get all the data up and publicly available in one place for everyone.
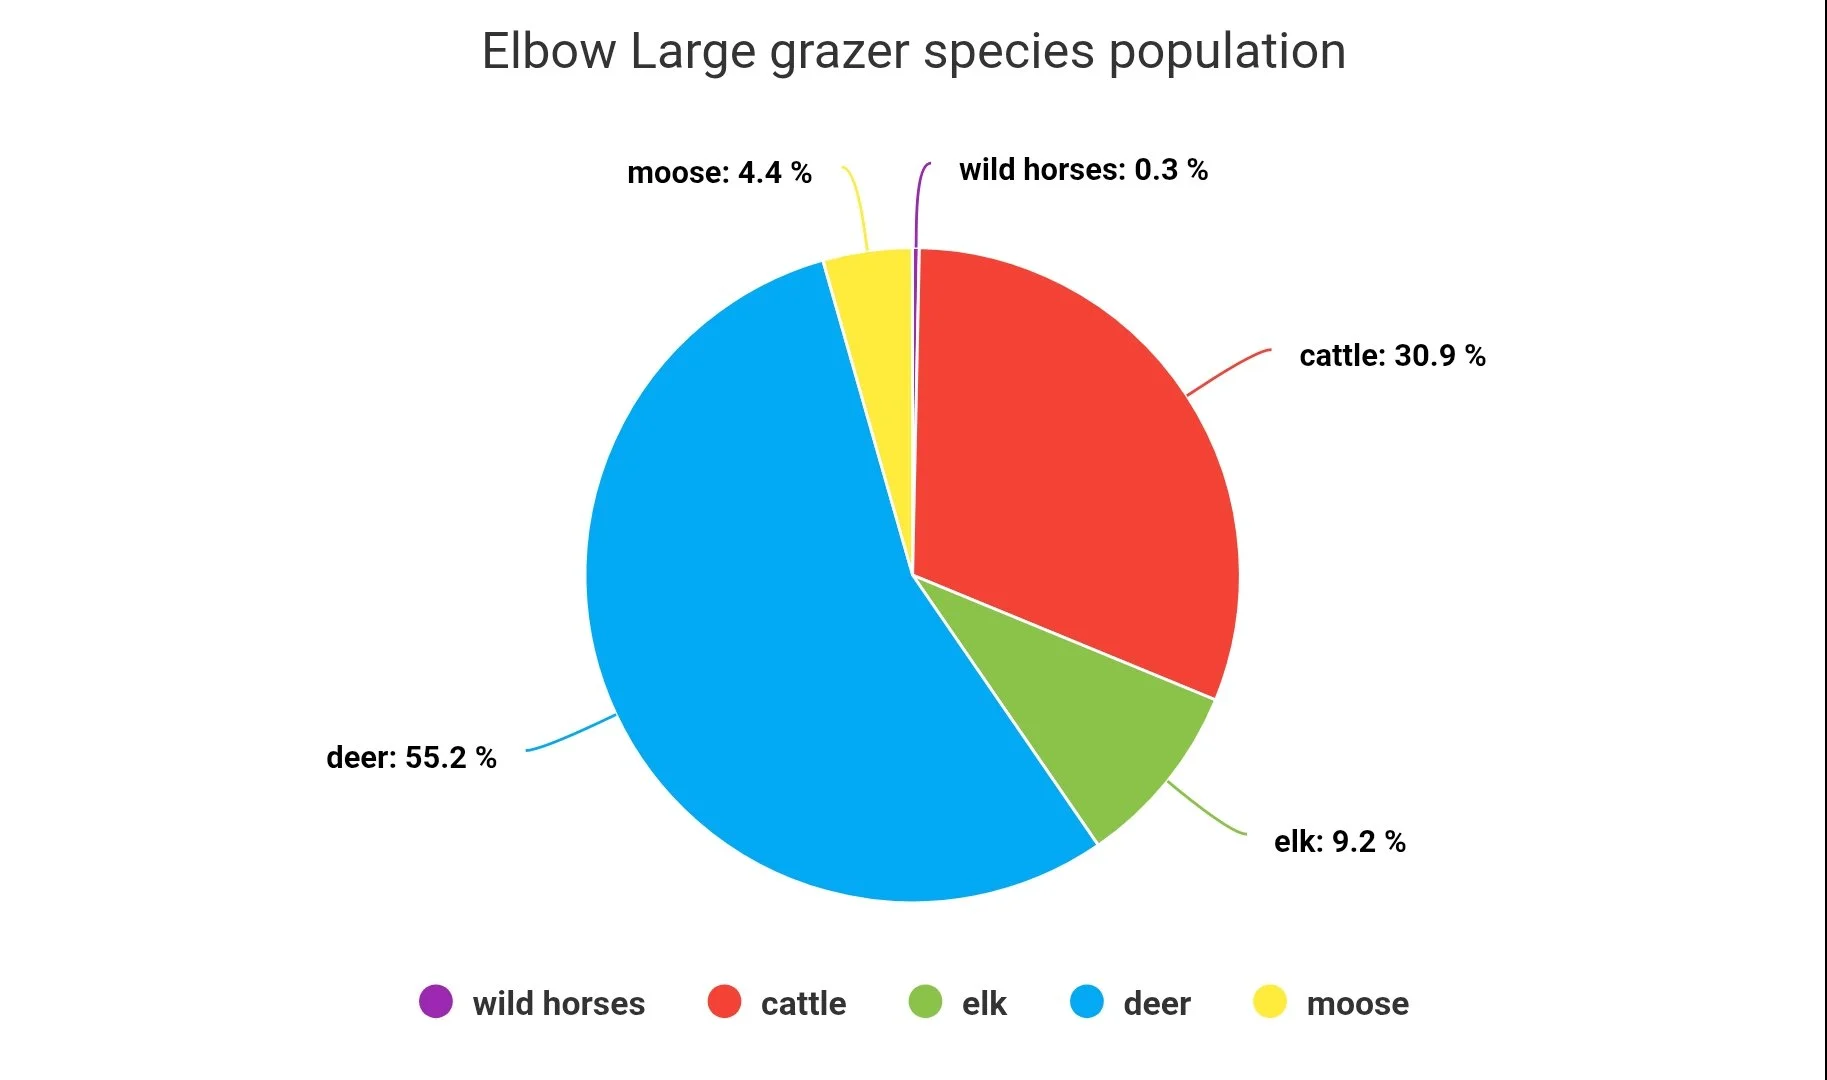
The last zone look in this specific study. The results are just as telling as every other zone. Again to keep everything understandable we will start from highest percentage down to the lowest.
Deer: 55.2%
Cattle: 30.9%
Elk: 9.2%
Moose: 4.4%
Wild horses: 0.3%
This is the zone that solidifies the patterns. With data and percentages alone. Deer remain high so this is a comman factor across all zones, while other populations go up and down fairly drastically like moose (31% down to 4%)
Deer- remain steadily near 50% of all grazing species in all 6 zones. This would mean, if any species is generally over populated in the eastern slopes, it is the deer.
Catlle- make up the second highest total grazing species population in Elbow zone too. Now with over 30% of all large grazing species in this zone. Can you believeout of all foraging species 30% of the “wildlife” you will see in Elbow is in fact, cattle? The only non native grazing species is the one you are second most likely to see in the Alberta wilderness and not a wild species at all. taking root at the top of the forage food chain in almost every equine zone. So we remain with 2 forage culprits, deer and cattle. While in Brazeau it can mostly be attributed to deer and moose (two native species).
Next we have elk. At just over 9% of the total grazing species in the Elbow zone, showing again, when cattle percentages spike, so do elk percentages. Again this can be from 1 of 2 things, they both prefer the same areas to graze (making cattle the biggest competition to elks prefered meadows) or 2, that the cattle give elk “safety in numbers” allowing their offspring to repopulaye well, due to more predators being fed of cow calves then elk calves. This may mean that elk are being targeted by large predators in other zones, meaning increasing moose and wild horse populations would help keep the elk out of the predators target line. We could essentially level the food chain with the other wild species as opposed to cattle, a non native species to north Americas ecosystem and their damaging foraging style.
Then we have moose. This is the most concerning level to us on all of our charts. As we see cattle population percentages skyrocket, in this zone as opposed to Brazeau or Nordegg, it seems to have the most drastic counter effect on the moose populations. Choosing to avoid highly cattle populated zones. If we decreased cattle and increased moose and wild horses, the elk population should stay fairly high too. In theory. Similar to what we see of the population increasing around cattle. Moose and wild horses prefer higher elevations and denser forests and meadows increasing their populations in this zone would level out the predators attacks on the elk. While removing the cattle or at least decreasing their over all percentage, should in theory, bring back more moose to the zone. Moose seem to appear the most pushed out in the eastern slopes, not elk, and it seems to be linked to the cattle, not the wild horses, while elk prefer the same meadows that cattle do, it also gives the predators more prey through young cow calves, which on paper, increases the elk population percentages. The same results should be able to be achieved if we decrease cattle but supplement this with another native large grazer (moose, Caribou, wild horses) and in theory this could also explain why we see so many Caribou populations dropping. If there is a lack of large grazers, the ones remaining have a heavy burden to carry with predators attacks. Although deer populations are high in all zones, they are the swiftest to escape predators, leaving the larger and slower grazers to take the toll from the predators. This may be why Elk increase around cattle. And wild horses could be a great replacement to the cattle, while they also would be less of a competitor on elks main meadows, as wild horses keep small bands and only join up in meadows for a few months of the year. Moose seem to be less impacted by wild horses than cattle, so if we want to increase elk populations we have to look at other large grazers to help fill the bellies of predators. With cattle bing the main other food source out of the large grazers, there is a gap needing to be filled in the natural ecosystem, the two better alternatives would in fact be wild horses and bison. Less likely to escape predators, giving elk and moose and Caribou time to grow their populations
The final statistic. Wild horses. A significant drop here which explains why we are seeing auction manifests in this zone, their herds are being diminished. At only 0.3% of the grazing species here. Cattle have now driven out moose and wild horses from the elbow zone. So lets look through this as a whole, wild horses over all have a 0.6% population percentage in the eastern slopes, 0.1% in Brazeau, Nordegg and Clearwater, 1.1% in sundre 1.2% in Ghost and 0.3% in Elbow. In most zones they are less than 1% of the total grazing species, meaning albertas ecosystem is severely lacking large slow grazers. Wild horses and bison. Leaving the smaller and faster grazers to face the predators alone, leading to often having the elk moose and Caribou on the run to live, burning more calories outrunning predators, and lowering numbers. With larger slower grazers in the mix, the faster grazers should have no problem surving and increasing numbers. Again in theory.
What we do know, is that the wild horses impact is minimal. Almost undocumentable when you look at the big picture. We should be protecting the wild horses not bringing another species to extinction. We have more research to come, so stay tuned as we dive deeper into more studies, all research data can be found on our sources page, while the pie charts in have created , the data is mixed from aerial survey data and wildlife population studies all linked in the sources page. Again we are not professional researchers or scientists, we are just a family striving to make sense of the data we see, and we share our process of understanding here. Analysis is my opinion from field research, data and observations. This study is for research and educational purposes.